18.3.2021 | 22:48
Unusually high temperatures
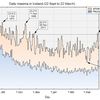
Many areas of Eastern Iceland experienced very high temperatures today (18 March 2021). The highest maxima was measured at Dalatangi, 20.4°C. This is almost as high as the Icelandic record for March, 20.5°C measured at Kvísker 29 March 2012 and the highest on the winter side of the vernal equinox. The temperature also reached 20 today at Neskaupstaður, not far from Dalatangi and was higher than 19 at a few other stations. Many local March records were broken as well, e.t. at the mountaintop station Gagnheiði, 949 m a.s.l. There today's maximum was 9.9°C, previous max at this location was 9.4°C.
Temperatures above 15 to 16°C "regularly" occur in Northern and Eastern Iceland during the winter months - especially at stations near the ocean AND near steep mountainsides which in very windy conditions favor mixing with warm air above.

The upper trace in the figure shows the day-to-day daily maximum temperature in Iceland from 22 September to 22 March (autumn to vernal equinox) since the beginning of regular observations. Maximum thermometer readings were uncommon before the 1930s. The last 20°C of autumn is registrered on 26 November - and the earliest 18 March (today). As seen there are quite many days which have not reached 15°C and a few are lower still, the lowest one is 29 February - with only 12.0°C - but this particular day only gets a chance every fourth year.
Dalatangi and the nearby Seyðisfjörður are the favorites for high winter temperatures, these two stations have collected 79 out of the 184 days in the range. High temperatures are also common at Seyðisfjörður during summer, but on occasions the winter maxima at Dalatangi have turned out to be the highest of the year.
About half of the records during this low-sun period are recorded in this century (2001 and later). This is party due to the increased density of recording stations - but as the stations "responsible" for a substantial part of the whole have been recording for a long time it is likely that the general warming of the climate is also involved. The oldest still surviving daily record is from Seyðisfjörður in 1907.
The lower trace in the figure are the daily maxima for Reykjavík - far below the countrywide numbers.
The air above Iceland was very warm today and yesterday (17 and 18 March 2021) and March temperature records were broken at the 400, 500, 700 and 850 hPa levels over Keflavík airport - going back to 1953.
 Bloggar | Slóð | Facebook | Athugasemdir (0)
28.3.2020 | 19:55
Unusually high sea level pressure
An unusually intensive high-pressure system is now (28 March 2020) situated to the south of Iceland. The highest sea level pressure value (slp) observed in Iceland today was 1050.5 hPa - at the station Hjarðarland in the southern lowland. This is the highest slp observed in Iceland since 16 April 1991 (1050.8 hPa) and the second highest slp in the month of March. The record is 1051.7 hPa, measured at Vestmannaeyjar 6 March 1883.
It should be noted that still higher values were nominally noted in the central highlands, the highest value 1054.2 hPa at the station Setur [695 m a.s.l). This high value is a result of a dubious reduction of the pressure down to sea level in light winds and very low temperature (-19°C) and will thus not be confirmed as a record value.
Pressure values above 1050 hPa are only seldomly seen in Iceland. The record is 1058 hPa, measured in Reykjavik on 4 January 1841 (uncertainty probably about 2 hPa) and the second highest measured in Stykkishólmur 16 December 1917, 1053.3 hPa (but possibly 1054.0 hPa). There are 11 known instances of a higher value than the one reached today, 1 in April, 1 in March, 3 in February, 4 in January and 2 in December. In some of the cases the high values were measured at more than one station.
Bloggar | Slóð | Facebook | Athugasemdir (0)
1.3.2020 | 23:03
Sea level pressure: Unusually low in Iceland this winter
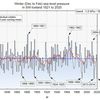
The sea level pressure has been persistently low in Iceland since early December. Pressure has been recorded in Iceland during 200 winters (Dec to Feb) now. The present average is tied for the lowest of the whole series along with the values for the winter of 2013 to 2015 and 1989 to 1990. Due to some measurement uncertainties there are three earlier record contenders as well (see figure below).

The figure shows the December to February averages from 1820-1821 to 2019-2020 (columns) and a 10-year running mean as well (red trace). There is a very large year-to-year variability - much larger than the measurement uncertainty - this variability seems to be more or less random, although some clustering of high or low values is evident - as seen in the considerable variability of the 10-year mean. The overall trend (-1.0 hPa/century) is insignificant (smaller than the possible measurement bias in the series).
The sea level pressure in Iceland is a very good indicator of the state of both the NAO and AO indices. The positive excursions of the pressure are concurrent with the negative values of the indices. There is a very good correlation between the pressure and temperature anomalies in large parts of Europe - also during the early part of the series. This relationship is not fixed in time, however, there are other factors in play as well - as e.g. global warming.
Although the AO index is usually not calculated further back than 1950 there is no ground for supposing that the good relationship between it and the winter pressure in Iceland as only existed throughout this post 1950-period - but not earlier. Some long-term discrepancies are, however, likely.
[For a discussion of the series and reference see:
Jones, P.D., T. Jónsson, and D. Wheeler, (1997) Extension to the North Atlantic Oscillation using early instrumental pressure observations from Gibraltar and South-West Iceland, International J. of Climatology Vol.17, 1433-1450]
Bloggar | Slóð | Facebook | Athugasemdir (0)
3.12.2019 | 17:17
A new national maximum temperature record for December
A record breaking "heatwave" passed Iceland last evening and night. It didn't last long but resulted in a new national maximum temperature record for December, 19.7°C at the station Kvísker, situated below the east flank of Iceland's highest mountain, Öræfajökull. The old national record was 18.4°C measured at Sauðanesviti at the north coast on 14 December 2001. This maximum was now exceeded at two other stations besides Kvísker, both in the northern part of the Eastern fjord area - near the easternmost point of Iceland, Bakkafjörður (maximum = 19.0°C) and Seyðisfjörður - Vestdalur (maximum 18.8°C).
This was due to an northerly excursion of very warm air from the south. According to the analysis of the ecmwf the 500/1000 hPa thickness over eastern Iceland exceeded 5540 meters, might be the highest December value on record for the area - but needs verification. According to the same source the potential temperature at 850 hPa reached 26.3°C at the same time. - Even so, the high temperatures at "ground level" is unusual but probably made possible by the lack of snow in the area and relatively dry ground after a very dry November, generally the driest since 1952 in the Northern part of the country.
Daily (calendar date) maxima were recorded at more than 200 stations, at stations with more than 10 years of observations the records were 178 on the December 2, 111 on December 3 and 20 on December 1.
Previous records for the whole month of December were exceeded or equalled at 53 automatic stations (more than 10 year of observations) and on three manned ones. At Akureyri in the north maximum temperatures have been recorded for 80 years (but temperature has been measured there much longer). During these 80 years the highest maximum was 15.1°C. This was exceeded now as the maximum thermometer this morning (3 December) was at 15.5°C.

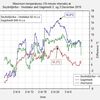
At the automatic stations the temperature is averaged over 2 minutes (thought to be comparable to the response time of a mercury thermometer), every 10-minutes there is a registration of the highest and lowest temperature during the preceding 10-minutes - the highest thus becomes the maximum of these 10-minutes. The figure shows the 10-minute maximum temperatures at the two stations that registered the highest maxima during this event, Kvísker and Bakkagerði during a 36-hour interval from 2 December to noon on 3 December. The rapid rise in temperature at both stations is notable - increasing wind then "exposes" the warm air aloft as it extends down to station level.

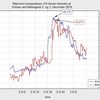
The second figure shows the temperature at Seyðisfjörður - Vestdalur (92 m a.s.l.) and Gagnheiði (949 m a.s.l.), the stations are located close to each other, one in a valley near a narrow fjord in the Eastern fjords area and the other on an exposed, but not steep, mountaintop nearby. The green trace shows the temperature difference between the stations. One might note that the temperature on the mountain is not as variable as down in the valley and the warm air aloft "struggles" to reach the valley bottom - during a short period the temperature on the mountain is higher than in the valley - even the altitude difference is about 850 meters.
Bloggar | Slóð | Facebook | Athugasemdir (0)
13.6.2019 | 17:10
A new sea level pressure record for June in Iceland
The pressure has been observed regularly in Iceland for almost 200 years. Prior to that there are gaps in the record. During the first 20 years there is only one observation per day from one station, but later the observing network became denser and more observations were made per day. From 1920 onwards use has been made of barographs to infer the variation of the pressure between readings.
Sea level pressure above 1035 hPa is not common in Iceland in the month of June and readings above 1040 hPa are exceptional, having occurred only once during the whole time of observations until past Tuesday. This occurred during the late afternoon and evening of 21 June 1939 in Stykkishólmur where 1040.4 hPa were then registered.
Last Tuesday evening the pressure rose to 1040.6 hPa at Reykjavik city airport and to slightly lower values at other stations in the vicinity. The following day the height of the 500 hPa-level over Keflavík was measured as 5870 meters, slightly above the old record height there in June, 5860 m (in June 1988). There is one slightly higher reading at 500 hPa in May 1975 over Keflavík (5880 m).
It is of interest to note that a German team of scientists made upper-air observations in Reykjavík during the spring and summer of 1939. They used a different standard atmosphere for their calculations, but after this has been amended their reading at the time of the 1939 pressure record is higher still at 500 hPa. The value in the c20v2-reanalysis (5960 m) fits well with the (amended) German ascent.
The absolute highest temperatures ever recorded in Iceland were measured during this same episode, 30.5°C at Teigarhorn at the East coast and 30.2°C at Kirkjubæjarklaustur in the SE, on 22 June 1939.
The ongoing episode has not been quite as warm as the one in 1939, the highest temperature value to the time of writing is 25.3°C - an absolute record at the station Skarðsfjöruviti (a lighthouse on the SE-coastal sands) which as been in operation since 1994.
Bloggar | Slóð | Facebook | Athugasemdir (0)
4.5.2019 | 20:59
An unusually warm April in Iceland
April 2019 was unusually warm in Iceland. In most of the West and North it was the warmest one on record and the second warmest in the country as a whole. The average temeperature in Reykjavík was 6.5°C, +3.6°C higher than the 1961-1990 mean and +0.2°C higher than the previous record (in April 1974). In Stykkishólmur in the west the average in April was 5.8°C, +4.2°C above the 1961-1990 mean - also a new record. In Akureyri April was also the warmest of all time with an average of 6.9°C, +5.3°C above the 1961-1990 mean.
The warm weather was "caused" by an unusually persistent spell of Southeasterly winds lasting almeost the whole month (except for the first few days).

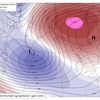
The map shows the average 500 hPa-height in April (ecmwf-analysis - map by Bolli Pálmason) and the very large deviation [colours], positive to the NE of Iceland and negative to the SW.
On the 30th the temperature in Reykjavík reached a new record maximum for April, 17.1°C, the former record, 15.2°C was old, from April 29 1942.
Some readers might want to check on links to texts about the situation in Icelandic [google translate might or might not be helpful]: The monthly report of the Icelandic Meteorological Office, Tíðarfar í apríl 2019, and two blogs on "hungurdiskar", Óvenjulegur apríl í háloftunum [an unusual upper-air April] and Meir af apríl [More on April - a discussion of the circulation and its part in the record].
Bloggar | Slóð | Facebook | Athugasemdir (0)
27.10.2018 | 22:32
A new October high pressure record in Iceland
On Saturday night, October 27 2018 a new sea level pressure maximum record was reached in Iceland for the month of October. This new record, 1046.0 hPa exceeded the old one, measured in Akureyri on October 20 1895, by 1,5 hPa (1044.5 hPa). The station at Gjögurflugvöllur, on the east coast of the Northwest Peninsula of Iceland is the site of the new record.
Bloggar | Slóð | Facebook | Athugasemdir (0)
3.9.2017 | 17:48
A new absolute September maximum temperature record in Iceland
Temperatures above 25°C are rare in Iceland in September and have only been registrered on a few occasions. On 1 September (2017) the maxmimum at Egilsstaðir airport reached 26.4°C. This is 0.4°C higher than the previous Icelandic record, measured at Dalatangi on 14 September 1949. The Egilsstaðir automatic station has been in place since 1998, but previously, manned synoptic observations had been made on the site or in the nearby village since the late 1940s. The first years of observations there were of dubious quality, but are considered to be reliable from 1955 onwards.
Egilsstaðir is a favoured site for high temperatures during summer and have measured higher temperatures than 26°C in June (max. 26.7°C), July (28.8°C) and August (29.2°C). The previous high in September was 22.0°C.
Location of Egilsstaðir: 65°16.571'N, 14°24.276'W, 23.5 m above sea level.
On 1 September many stations in the North and East part of the country topped their previous September maxima.
The highest temperature measured in Iceland this summer is 27.7°C, at the station Végeirsstaðir in the North on 25 July and was the highest temperature measured in Iceland since 2012.
Bloggar | Breytt s.d. kl. 17:56 | Slóð | Facebook | Athugasemdir (0)
31.12.2015 | 15:19
An unusually low pressure recorded in Iceland
During the night and morning of 30 December 2015 an unusually deep low crossed Iceland. The minimum officially recorded sea level pressure was 930.2 hPa, measured at the station Kirkjubæjarklaustur in the Southeast at 5am. This is the lowest sea level reading in Iceland since 24 December 1989 when the pressure at Stórhöfði in the islands of Vestmannaeyjar measured 929.5 hPa. On 5 January 1983 the pressure at Stórhöfði was down to 929.9 hPa.
During the morning hours the low crossed the country from the south to the north. The map below shows the situation at 9 am.

The lowest reading in the North was at Akureyri at 8 am, 932.0 hPa, the second lowest ever recorded there, exceeded only by the 931.4 hPa measured on 3 January 1933. At that occation the lowest pressure in the country was 923.9 hPa (Vestamannaeyjar).
The lowest pressure ever recorded in Iceland is 919.7 hPa, measured at Vestmannaeyjar 2 December 1929. However, the reading was made during strong winds, Bf 11. This throws some doubt on the exact value of the pressure, but it was certainly lower than the 1933 reading (when the wind was not a problem).
There is also a measurement of 929.0 hPa made at Vestmannaeyjar on 27 December 1914.
There are two (or three) measurements of below 930 hPa pressure in Iceland during the 19th century. Two are considered quite sound, but the exact hPa values can be debated. The third one was made, but later retracted by the observer after an inquiery, however, there are some doubts remaining, because of wind damages that occurred on the same day.
As seen on the map above the wind was strongest on the eastern side of the low pressure centre. Hurricane force winds (10-min sustained >32.7 m/s) were recorded on 7 stations, the maximum being, 43.9 m/s at the mountainpass Vatnsskarð in the east, the highest sustained value at a coastal station was 38.6 m/s, at Papey. A gust of 63.8 m/s was recorded at the station Steinar in the south, but has not been ratified at the time of writing.
There was considerable local wind damage in the east, but the main damage was caused by an unusually high sea level inside the eastern fjords where a few seaside houses are probably beond repair. No human injuries were sustained by the weather.
This was the second great storm to hit Iceland this Deceember. The first one [on 7 and 8 December] was worse in terms of wind and damage, affecting more than 2/3 of the country, blowing cars of roads and destroying houses. Hurricane force winds (sustained) were then measured on 33 stations (compared to 7 now, as mentioned above), the maximum being 50.9 m/s.
Bloggar | Slóð | Facebook | Athugasemdir (0)
24.2.2015 | 11:34
An unusually warm year in Iceland, 2014
The Icelandic Meteorological Office has issued its official statement of the climate in Iceland in 2014 in English. In the Eastern part of the country and in some of the northern areas as well it was the warmest year ever measured and in the rest of the country it was generally the second or third warmest, slightly exceeded by the temperature in 2003 or 1933.
It was the 19th consecutive year of above normal annual temperature in Reykjavík (vis. 1961 to 1990). The annual temperature in Surtsey, 7.2°C is the highest annual mean temperature ever registered at an Icelandic weather station, exceeding the temperature at the same site in 2010 by 0.1°C.
In spite of the high temperatures the weather was changeable and often dull. The first months of the year were especially wet in the North and East and the weather was difficult. In the west it was very dry at the same time with favorable weather conditions. The summer was warm and considered fine in the North and East but in the south it was very wet and dull. The autumn was fine, November extraordinarily warm, but the year ended with an unruly and a rather cold December.
The precipitation in 2014 was above normal at most stations, as was the number of days with precipitation. Snow was light in Reykjavík, as generally in the South and West. Snow covered the ground in Reykjavík for 41 days during 2014, 24 days less than average. The snow was heavy in Akureyri in and covering the ground for 133 days during the whole year 2014, 16 days more than average.
There was less sunshine in Reykjavík and Akureyri than during the recent years, about 100 below the 1961 to 1990 average at both locations and 200 below the average of 2004 to 2013.
The average sea level pressure in Reykjavík was 1001.7 hPa, 4.2 hPa below the average 1961 til 1990. In the long term it is rather low, but the annual pressure in 2011 was lower still.
The wind speed was close to the average for the year as a whole, but December and February were very windy, June was unusually calm. Easterly and Northerly winds were unusually persistent in January and February, westerly and southerly winds were prevalent in September and easterly in November.
Bloggar | Slóð | Facebook | Athugasemdir (0)
Um bloggið
Iceland Weather blog

Nýjustu færslur
- Unusually high temperatures
- Unusually high sea level pressure
- Sea level pressure: Unusually low in Iceland this winter
- A new national maximum temperature record for December
- A new sea level pressure record for June in Iceland
- An unusually warm April in Iceland
- A new October high pressure record in Iceland
- A new absolute September maximum temperature record in Iceland
 hoskibui
 svatli
Nýjustu myndir
Heimsóknir
Flettingar
- Í dag (16.4.): 2
- Sl. sólarhring: 2
- Sl. viku: 9
- Frá upphafi: 10246
Annað
- Innlit í dag: 2
- Innlit sl. viku: 9
- Gestir í dag: 2
- IP-tölur í dag: 2
Uppfært á 3 mín. fresti.
Skýringar