Bloggfærslur mánaðarins, mars 2012
30.3.2012 | 14:23
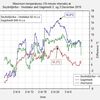
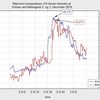
A new March maximum temperature record in Iceland
The last week has been warm in Iceland, especially in the north and east. Daily station records have been exceeded by the hundreds and also daily countrywide maxima on a few days. On Thursday 29 March the temperature at the farm Kvísker on the Southeast coast the maximum temperature reached 20.5 degrees C. This is a new March record for the whole of Iceland exceeding the old one by the large margin of 1.7 deg C.
The old record, 18.8 deg C, was set on 28 March 2000 in the town of Eskifjörður in the Eastern Fjords.
The individual monthly temperature maxima in Iceland are:
| Mon | Year | Month | Day | maximum °C | Station | ||
| January | 2000 | 1 | 15 | 19,6 | Dalatangi | East | |
| February | 1998 | 2 | 17 | 18,1 | Dalatangi | East | |
| March | 2012 | 3 | 29 | 20,5 | Kvísker | Southeast | |
| April | 2007 | 4 | 29 | 23,0 | Ásbyrgi | Northeast | |
| May | 1992 | 5 | 26 | 25,6 | Vopnafjörður | Northeast | |
| June | 1939 | 6 | 22 | 30,5 | Teigarhorn | East | |
| July | 1946 | 7 | 17 | 30,0 | Hallormsstaður | East | |
| August | 2004 | 8 | 11 | 29,2 | Egilsstaðaflugvöllur | East | |
| September | 1949 | 9 | 12 | 26,0 | Dalatangi | East | |
| October | 1973 | 10 | 1 | 23,5 | Dalatangi | East | |
| November | 1999 | 11 | 11 | 23,2 | Dalatangi | East | |
| December | 2001 | 12 | 14 | 18,4 | Sauðanesviti | North |
The official statement of the Icelandic Meteorological Office.
Dalatangi is a lighthouse on an peninsula at the East coast. It often experiences short „heat waves“ caused by decending warm air aloft along the very steep mountainside on the peninsula. The Dalatangi winter maxima have no diurnal preferences and often occur in the middle of the night. The station is however one of the most oceanic in Iceland the annual range of monthly temperatures is only 8.2 degrees C. At a few oceanic stations the heat waves of winter occasionally offer the highest maxima of the year. Later, I will give a list of these at this blog.
The station Sauðanesviti (Sauðanes lighthouse) is on the tip of a peninsula in the North, the topographical conditions are similar to the ones at Dalatangi.
The topography at Teigarhorn in the East is also similar to Dalatangi and Sauðanesviti. The warm descending winds are not as common as in the other locations, but the aspect to the noon sun in summer is more favourable.
Kvísker is located near the highest mountain in Iceland, Öræfajökull (a dormant volcano). The maxima at Kvísker typically occur in westerly winds blowing along the side and downwards the slope near the station.
The remaining stations are all located in the valleys of the northeast and east. Vopnafjörður at the seaside in a broad fjord, Ásbyrgi in a very broad valley, but not far from the coast and Hallormsstaður and Egilsstaðir airport well inland in the largest valley of the East.
 Bloggar | Slóð | Facebook | Athugasemdir (0)
21.3.2012 | 14:15
Reykjavík - monthly means as originally published
Measurements in the modern style started in Reykjavík in May 1880. There are earlier observations available but made with unsheltered wall instruments. These can be added to the series back to 1866 and observations were also made in Reykjavík during 1820 to 1854. We will hopefully look at these early measurements later.
The history of the Reykjavík station is quite complicated. The Reykjavík station was operated by the Danish Met. Institute (DMI) from 1880 to 1910 and monthly mean temperatures were published in the yearbooks of the Institute (Meteorologisk Aarbog) which are available online (see an earlier post). During this period there were a few observers and the station was relocated within the town three or four times. A wall-mounted instrument screen was used during the first part of the early period but it was later replaced by a free standing one - the first one in Iceland.
The thermal characteristics of the early screens are better known than elsewhere in Iceland at this time as it was for a considerable period equipped with a thermograph which was read every hour. So we know the diurnal cycle quite well. It conforms well with later-time diurnal cycle observations. A few months of thermograph sheets are missing.
The main thermometer was read three times per day at fixed hours. The DMI always used the average of these + a separate fixed constant for each month (to account for the seasonal variation of the diurnal range). In comparison with modern methods these early calculations tend to have a daytime bias - resulting in slightly elevated temperatures. This is one of the main reasons for the adjustments that have been used later on the means. We will look at this problem later.
The climatic station in Reykjavík stopped making observations in December 1910, temperature measurements continued at a telegraph station in the town but data from this station were never published - and are not used in the attached dataset, except during 1920 and 1921 - which were published.
When the station in Reykjavík was discontinued in 1910 a new one was established just out of town at the newly built Vífilsstaðir sanitarium. This location is slightly warmer in summer but colder in winter than the downtown stations. The published monthly means from this station are included in the attached dataset.
During the early period from 1880 to 1920 a few months are missing from the DMI publication. The Icelandic Meteorological Office (IMO) was established in 1920 and took over the DMI station net. Proper observations began again in Reykjavík (in a wall screen) in May 1920. Observations were made at fixed hours. In 1924 a thermograph was introduced again at the station and during 1924 to 1948 all the published temperature means in Reykjavík were calculated as the average of thermograph readings every two hours. There were daily comparisons of the thermograph and the fixed hour observations.
Since 1949 the Reykjavík monthly mean is calculated as the average of observations made every three hours.
The DMI also published the average monthly minimum temperature during the first few years. A minimum thermometer was, however, in use in Reykjavík during most of the early period, but the means were not published. The minimum thermometer was used for the calibration of the thermograph mentioned above during most of the 1884 to 1907 period.
The IMO has published monthly means of maximum and minimum thermometer readings since 1920. These means are included in the attached dataset.

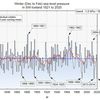
The figure shows the annual mean temperature in Reykjavík 1881 to 2011 (as published). No external adjustments have been used.
Relocations are marked with vertical lines. In late 1931 the station was relocated to a rooftop in the town centre and remained there until the end of 1945. The data (above and in the attachment) have not been adjusted for this change nor others. Later versions of the dataset (e.g. the one available at the IMO website) do include adjustments for the relocations. All adjustments are subject to revisions at a later date.
Some internal adjustments are needed during the early part of the series due to later changes in calculation methods. The fixed-hour means that form the basis of both the DMI average method and recent adjustments by the IMO will be made available at this website later.
The data in the attachment are semicolon delimited with a period as decimal seperator.
 Reykjavík unadjusted temperature
Bloggar | Slóð | Facebook | Athugasemdir (0)
14.3.2012 | 13:28
Snowcover in Reykjavík and Akureyri
In Reykjavík in the Southwest, and in most of the surrounding lowlands, the snowfall is surprisingly light and many winter days are entirely snow-free. The snow is a bit more persistent at Akureyri in the north. Until recently tourism in Iceland has been more or less concentrated in the summer, but in recent years the influx of tourists has been increasing in the winter as well. I receive more and more enquiries on the snow cover and below you can find two standard tables summarizing the situation in Reykjavík and Akureyri during the period 1981 to 2010. It must be noted however that there is considerable year-to-year variability in the snow conditions. The table is also found in a text-file appendix for easier viewing (see the bottom of the page).
Snow cover and snowfall in Reykjavík and Akureyri 1981 to 2010
table headings are explained below):
Reykjavík (Southwest part of the country)
STOD MON ALHV ALAU SNB SNFJ SNDG SLALLS SNALLS URKALLS TEL
1 1 13.6 12.7 51.7 78.7 13.8 42.1 12.4 83.0 30
1 2 12.8 10.5 54.0 80.6 14.0 49.1 12.4 85.9 30
1 3 12.1 12.4 49.6 81.6 15.1 55.3 11.1 81.4 30
1 4 3.2 23.1 16.9 62.9 8.0 27.1 3.9 56.0 30
1 5 0.2 30.5 1.2 38.0 2.1 11.1 0.8 52.8 30
1 6 0.0 30.0 0.0 13.0 0.2 0.8 0.0 43.8 30
1 7 0.0 31.0 0.0 0.7 0.0 0.0 0.0 52.3 30
1 8 0.0 31.0 0.0 0.1 0.0 0.1 0.0 67.3 30
1 9 0.0 30.0 0.0 7.3 0.9 3.3 0.0 73.5 30
1 10 1.0 28.6 5.5 33.6 3.9 18.8 0.9 74.4 30
1 11 6.2 20.6 25.9 61.5 8.7 37.2 5.2 78.8 30
1 12 12.2 15.0 45.4 73.8 13.5 54.3 10.0 94.1 30
The earliest case of snow covering the ground in Reykjavík is on 9 September 1926. There are cases of snow covering the ground in Reykjavík in early June, but it has always melted
before the offical morning observation (09 hrs).
Akureyri (Northern part of the country)
STOD MAN ALHV ALAU SNB SNFJ SNDG SLALLS SNALLS URKALLS TEL
422 1 21.2 5.2 75.7 90.3 15.5 25.0 30.0 60.7 30
422 2 17.2 5.1 71.5 88.5 13.5 14.8 32.1 50.6 30
422 3 16.5 6.6 66.0 88.5 15.6 19.1 25.3 49.7 30
422 4 8.8 13.5 42.2 82.2 10.4 12.2 12.4 28.5 30
422 5 0.5 27.5 6.5 59.6 4.1 8.0 0.8 22.2 30
422 6 0.0 29.9 0.3 30.6 0.5 1.8 0.1 20.7 30
422 7 0.0 31.0 0.0 7.2 0.1 0.2 0.0 32.1 30
422 8 0.0 31.0 0.1 1.1 0.1 0.4 0.0 41.5 30
422 9 0.1 29.5 1.0 19.7 1.9 7.0 0.1 46.8 30
422 10 4.7 22.1 22.3 60.5 8.9 25.6 9.9 72.2 30
422 11 13.5 9.9 56.1 80.9 12.3 26.6 18.7 58.8 30
422 12 17.8 8.6 64.7 86.6 14.2 19.6 29.3 57.0 30
The earliest case of snow covering the ground in Akureyri is on 7 September 1940, the official snowcover observations started in 1924. The snow probably reached sea level in Akureyri during the first days of August 1912. There are a few cases of snow covering the ground in Akureyri in the middle of June. Table headings:
STOD: station id
MAN : month (1-12)
ALHV : number of days with 100% snow cover
ALAU : number of days with no (0%) snow cover
SNB : average snowcover during the whole month (%)
SNFJ : average snowcover at 500-700 meters in nearby mountains (%)
SNDG : Number of days with snowfall or (snow and rain mixed) as precipitation type
SLALLS : Average total precipitation (mm) as snow and rain mixed
SNALLS : Average total precipitation (mm) as snow
URKALLS : Average total precipitation (mm) (all types)
TEL : number of years (here: 1981 to 2010)end
Bloggar | Slóð | Facebook | Athugasemdir (0)
13.3.2012 | 00:21
Links to published temperature series
Those interested in the original and adjusted monthly means of temperatures in Iceland are advised to check on these links:
There is no mystery surrounding the data from the Icelandic Meteorological Office.
The current version (2003) of the Reykjavík data is available at the website of the IMO (and has been for many years): http://www.vedur.is/Medaltalstoflur-txt/Reykjavik.txt
and the Stykkishólmur series (has not been adjusted since 1975 – only updated: http://www.vedur.is/Medaltalstoflur-txt/Stykkisholmur.txt
and Akureyri (2003 version): http://www.vedur.is/Medaltalstoflur-txt/Akureyri.txt
and Vestmannaeyjar (2003 version) http://www.vedur.is/Medaltalstoflur-txt/Storhofdi.txt
and Teigarhorn (1981 version – only updated) http://www.vedur.is/Medaltalstoflur-txt/Teigarhorn.txt
Monthly values at all stations since 1949 (1961 for secondary stations) at (click on station name): http://www.vedur.is/Medaltalstoflur-txt/Manadargildi.html
Eariler published values are available at the timarit.is website For 1924 to 1997 at: http://timarit.is/view_page_init.jsp?pubId=278&lang=is
The text is in Icelandic but in 1925 to 1956 monthly values are found at the second page of every monthly report. After 1956 the table is on pages 4 and 6. Earlier original values are available at the same site.1920 to 1923 at:
http://timarit.is/view_page_init.jsp?pubId=240&lang=is
and 1873 to 1919 at:
http://timarit.is/view_page_init.jsp?pubId=241&lang=is
Everyone can look up the numbers and compare both adjusted and earlier published values. Most of the later adjustments that have been made by the IMO are concerned with changes in the observing hours that neccessiate slight adjustments. The methodology of the current calculation of monthly means is described in detail in:
http://www.vedur.is/media/vedurstofan/utgafa/greinargerdir/1995/Climatological1960.pdf
Exactly the same method has been in use since 1956.
Bloggar | Slóð | Facebook | Athugasemdir (0)
Um bloggið
Iceland Weather blog

Nýjustu færslur
- Unusually high temperatures
- Unusually high sea level pressure
- Sea level pressure: Unusually low in Iceland this winter
- A new national maximum temperature record for December
- A new sea level pressure record for June in Iceland
- An unusually warm April in Iceland
- A new October high pressure record in Iceland
- A new absolute September maximum temperature record in Iceland
 hoskibui
 svatli
Nýjustu myndir
Heimsóknir
Flettingar
- Í dag (11.7.): 0
- Sl. sólarhring:
- Sl. viku: 3
- Frá upphafi: 0
Annað
- Innlit í dag: 0
- Innlit sl. viku: 3
- Gestir í dag: 0
- IP-tölur í dag: 0
Uppfært á 3 mín. fresti.
Skýringar