4.6.2012 | 11:52
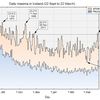
May 2012 in Iceland
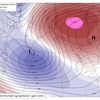
On the whole the temperature was close to the long-term average of the season. Actually the month was divided into two long spells, the first a very cold one lasting from the 6th to the 19th and a warm and sunny one for the rest of the month.
The weather was unusually sunny. In Reykjavík it was the 5th sunniest May since the beginning of observations in 1911 and in Akureyri (in the north) it was the second sunniest one, the observations starting there in 1928.
During the cold spell three new daily minimum records were set for the whole country. This was on the the 7th at Setur in the central highland, -13,7°C (older record, -13,4°C), on the 17th when the temperature at Brúarjökull in the eastern inland dropped down to -16,6°C (older one -11,0°C), and on the 18th also at Brúarjökull -13,1°C (older one -11,9°C). No new daily records for the country were exceeded in the inhabited areas where the observation series are much longer than in the highland. Many daily records where, however, exceeded at the individual stations during the cold spell, and also during the following warm spell.
The highest temperature measured in Iceland in May was 22,0°C at Kollaleira in the east on the 26th. The 20deg mark was exceeded somewhere in the country on six days in a row during the warm spell. This is unusual in May.
The full report for May (in Icelandic) is available at the web of the Icelandic Met. Office.
 Bloggar | Slóð | Facebook | Athugasemdir (0)
3.5.2012 | 10:56
April colder than March in almost half of Iceland in 2012
April was colder than March in many parts of Scandinavia (met.no; smhi.se). This was also the case in the Eastern part of Iceland. On a whole this happened at 44% of the automatic stations. (Results are not in from all of the manned ones).
That April happens to be colder in March is not that unusual, however. If all of the stations in all years are taken into the batch March is warmer than April about 17% of the time. On about 36% of the years at least one station is colder in April than in March.
One April out of 10 is colder than March at almost all (or all) of the stations. A majority of the stations had a colder April than March in 2010, but one has to go back to 1977 to find an all out April colder than March.
The likelyhood of a colder April after March is of course largest when March has been unusually warm. This was the case now.
But as a whole April was a rather warm month in Iceland, most of the stations had average temperatures above the 1961 to 1990 normal. Only a few stations in the East had below average temperatures.
The lowest temperature in the country was -25.7°C on the 2. (Brúarjökull, in the Eastern highland), but the highest 18.2°C on the 30. (Hallormsstaður, in a deep eastern valley).
April was rather dry in most areas.
Official IMO April overview (in Icelandic only).
Bloggar | Breytt s.d. kl. 17:06 | Slóð | Facebook | Athugasemdir (0)
30.3.2012 | 14:23
A new March maximum temperature record in Iceland
The last week has been warm in Iceland, especially in the north and east. Daily station records have been exceeded by the hundreds and also daily countrywide maxima on a few days. On Thursday 29 March the temperature at the farm Kvísker on the Southeast coast the maximum temperature reached 20.5 degrees C. This is a new March record for the whole of Iceland exceeding the old one by the large margin of 1.7 deg C.
The old record, 18.8 deg C, was set on 28 March 2000 in the town of Eskifjörður in the Eastern Fjords.
The individual monthly temperature maxima in Iceland are:
| Mon | Year | Month | Day | maximum °C | Station | ||
| January | 2000 | 1 | 15 | 19,6 | Dalatangi | East | |
| February | 1998 | 2 | 17 | 18,1 | Dalatangi | East | |
| March | 2012 | 3 | 29 | 20,5 | Kvísker | Southeast | |
| April | 2007 | 4 | 29 | 23,0 | Ásbyrgi | Northeast | |
| May | 1992 | 5 | 26 | 25,6 | Vopnafjörður | Northeast | |
| June | 1939 | 6 | 22 | 30,5 | Teigarhorn | East | |
| July | 1946 | 7 | 17 | 30,0 | Hallormsstaður | East | |
| August | 2004 | 8 | 11 | 29,2 | Egilsstaðaflugvöllur | East | |
| September | 1949 | 9 | 12 | 26,0 | Dalatangi | East | |
| October | 1973 | 10 | 1 | 23,5 | Dalatangi | East | |
| November | 1999 | 11 | 11 | 23,2 | Dalatangi | East | |
| December | 2001 | 12 | 14 | 18,4 | Sauðanesviti | North |
The official statement of the Icelandic Meteorological Office.
Dalatangi is a lighthouse on an peninsula at the East coast. It often experiences short „heat waves“ caused by decending warm air aloft along the very steep mountainside on the peninsula. The Dalatangi winter maxima have no diurnal preferences and often occur in the middle of the night. The station is however one of the most oceanic in Iceland the annual range of monthly temperatures is only 8.2 degrees C. At a few oceanic stations the heat waves of winter occasionally offer the highest maxima of the year. Later, I will give a list of these at this blog.
The station Sauðanesviti (Sauðanes lighthouse) is on the tip of a peninsula in the North, the topographical conditions are similar to the ones at Dalatangi.
The topography at Teigarhorn in the East is also similar to Dalatangi and Sauðanesviti. The warm descending winds are not as common as in the other locations, but the aspect to the noon sun in summer is more favourable.
Kvísker is located near the highest mountain in Iceland, Öræfajökull (a dormant volcano). The maxima at Kvísker typically occur in westerly winds blowing along the side and downwards the slope near the station.
The remaining stations are all located in the valleys of the northeast and east. Vopnafjörður at the seaside in a broad fjord, Ásbyrgi in a very broad valley, but not far from the coast and Hallormsstaður and Egilsstaðir airport well inland in the largest valley of the East.
Bloggar | Slóð | Facebook | Athugasemdir (0)
21.3.2012 | 14:15
Reykjavík - monthly means as originally published
Measurements in the modern style started in Reykjavík in May 1880. There are earlier observations available but made with unsheltered wall instruments. These can be added to the series back to 1866 and observations were also made in Reykjavík during 1820 to 1854. We will hopefully look at these early measurements later.
The history of the Reykjavík station is quite complicated. The Reykjavík station was operated by the Danish Met. Institute (DMI) from 1880 to 1910 and monthly mean temperatures were published in the yearbooks of the Institute (Meteorologisk Aarbog) which are available online (see an earlier post). During this period there were a few observers and the station was relocated within the town three or four times. A wall-mounted instrument screen was used during the first part of the early period but it was later replaced by a free standing one - the first one in Iceland.
The thermal characteristics of the early screens are better known than elsewhere in Iceland at this time as it was for a considerable period equipped with a thermograph which was read every hour. So we know the diurnal cycle quite well. It conforms well with later-time diurnal cycle observations. A few months of thermograph sheets are missing.
The main thermometer was read three times per day at fixed hours. The DMI always used the average of these + a separate fixed constant for each month (to account for the seasonal variation of the diurnal range). In comparison with modern methods these early calculations tend to have a daytime bias - resulting in slightly elevated temperatures. This is one of the main reasons for the adjustments that have been used later on the means. We will look at this problem later.
The climatic station in Reykjavík stopped making observations in December 1910, temperature measurements continued at a telegraph station in the town but data from this station were never published - and are not used in the attached dataset, except during 1920 and 1921 - which were published.
When the station in Reykjavík was discontinued in 1910 a new one was established just out of town at the newly built Vífilsstaðir sanitarium. This location is slightly warmer in summer but colder in winter than the downtown stations. The published monthly means from this station are included in the attached dataset.
During the early period from 1880 to 1920 a few months are missing from the DMI publication. The Icelandic Meteorological Office (IMO) was established in 1920 and took over the DMI station net. Proper observations began again in Reykjavík (in a wall screen) in May 1920. Observations were made at fixed hours. In 1924 a thermograph was introduced again at the station and during 1924 to 1948 all the published temperature means in Reykjavík were calculated as the average of thermograph readings every two hours. There were daily comparisons of the thermograph and the fixed hour observations.
Since 1949 the Reykjavík monthly mean is calculated as the average of observations made every three hours.
The DMI also published the average monthly minimum temperature during the first few years. A minimum thermometer was, however, in use in Reykjavík during most of the early period, but the means were not published. The minimum thermometer was used for the calibration of the thermograph mentioned above during most of the 1884 to 1907 period.
The IMO has published monthly means of maximum and minimum thermometer readings since 1920. These means are included in the attached dataset.

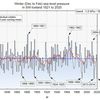
The figure shows the annual mean temperature in Reykjavík 1881 to 2011 (as published). No external adjustments have been used.
Relocations are marked with vertical lines. In late 1931 the station was relocated to a rooftop in the town centre and remained there until the end of 1945. The data (above and in the attachment) have not been adjusted for this change nor others. Later versions of the dataset (e.g. the one available at the IMO website) do include adjustments for the relocations. All adjustments are subject to revisions at a later date.
Some internal adjustments are needed during the early part of the series due to later changes in calculation methods. The fixed-hour means that form the basis of both the DMI average method and recent adjustments by the IMO will be made available at this website later.
The data in the attachment are semicolon delimited with a period as decimal seperator.
 Reykjavík unadjusted temperature
Bloggar | Slóð | Facebook | Athugasemdir (0)
14.3.2012 | 13:28
Snowcover in Reykjavík and Akureyri
In Reykjavík in the Southwest, and in most of the surrounding lowlands, the snowfall is surprisingly light and many winter days are entirely snow-free. The snow is a bit more persistent at Akureyri in the north. Until recently tourism in Iceland has been more or less concentrated in the summer, but in recent years the influx of tourists has been increasing in the winter as well. I receive more and more enquiries on the snow cover and below you can find two standard tables summarizing the situation in Reykjavík and Akureyri during the period 1981 to 2010. It must be noted however that there is considerable year-to-year variability in the snow conditions. The table is also found in a text-file appendix for easier viewing (see the bottom of the page).
Snow cover and snowfall in Reykjavík and Akureyri 1981 to 2010
table headings are explained below):
Reykjavík (Southwest part of the country)
STOD MON ALHV ALAU SNB SNFJ SNDG SLALLS SNALLS URKALLS TEL
1 1 13.6 12.7 51.7 78.7 13.8 42.1 12.4 83.0 30
1 2 12.8 10.5 54.0 80.6 14.0 49.1 12.4 85.9 30
1 3 12.1 12.4 49.6 81.6 15.1 55.3 11.1 81.4 30
1 4 3.2 23.1 16.9 62.9 8.0 27.1 3.9 56.0 30
1 5 0.2 30.5 1.2 38.0 2.1 11.1 0.8 52.8 30
1 6 0.0 30.0 0.0 13.0 0.2 0.8 0.0 43.8 30
1 7 0.0 31.0 0.0 0.7 0.0 0.0 0.0 52.3 30
1 8 0.0 31.0 0.0 0.1 0.0 0.1 0.0 67.3 30
1 9 0.0 30.0 0.0 7.3 0.9 3.3 0.0 73.5 30
1 10 1.0 28.6 5.5 33.6 3.9 18.8 0.9 74.4 30
1 11 6.2 20.6 25.9 61.5 8.7 37.2 5.2 78.8 30
1 12 12.2 15.0 45.4 73.8 13.5 54.3 10.0 94.1 30
The earliest case of snow covering the ground in Reykjavík is on 9 September 1926. There are cases of snow covering the ground in Reykjavík in early June, but it has always melted
before the offical morning observation (09 hrs).
Akureyri (Northern part of the country)
STOD MAN ALHV ALAU SNB SNFJ SNDG SLALLS SNALLS URKALLS TEL
422 1 21.2 5.2 75.7 90.3 15.5 25.0 30.0 60.7 30
422 2 17.2 5.1 71.5 88.5 13.5 14.8 32.1 50.6 30
422 3 16.5 6.6 66.0 88.5 15.6 19.1 25.3 49.7 30
422 4 8.8 13.5 42.2 82.2 10.4 12.2 12.4 28.5 30
422 5 0.5 27.5 6.5 59.6 4.1 8.0 0.8 22.2 30
422 6 0.0 29.9 0.3 30.6 0.5 1.8 0.1 20.7 30
422 7 0.0 31.0 0.0 7.2 0.1 0.2 0.0 32.1 30
422 8 0.0 31.0 0.1 1.1 0.1 0.4 0.0 41.5 30
422 9 0.1 29.5 1.0 19.7 1.9 7.0 0.1 46.8 30
422 10 4.7 22.1 22.3 60.5 8.9 25.6 9.9 72.2 30
422 11 13.5 9.9 56.1 80.9 12.3 26.6 18.7 58.8 30
422 12 17.8 8.6 64.7 86.6 14.2 19.6 29.3 57.0 30
The earliest case of snow covering the ground in Akureyri is on 7 September 1940, the official snowcover observations started in 1924. The snow probably reached sea level in Akureyri during the first days of August 1912. There are a few cases of snow covering the ground in Akureyri in the middle of June. Table headings:
STOD: station id
MAN : month (1-12)
ALHV : number of days with 100% snow cover
ALAU : number of days with no (0%) snow cover
SNB : average snowcover during the whole month (%)
SNFJ : average snowcover at 500-700 meters in nearby mountains (%)
SNDG : Number of days with snowfall or (snow and rain mixed) as precipitation type
SLALLS : Average total precipitation (mm) as snow and rain mixed
SNALLS : Average total precipitation (mm) as snow
URKALLS : Average total precipitation (mm) (all types)
TEL : number of years (here: 1981 to 2010)end
Bloggar | Slóð | Facebook | Athugasemdir (0)
13.3.2012 | 00:21
Links to published temperature series
Those interested in the original and adjusted monthly means of temperatures in Iceland are advised to check on these links:
There is no mystery surrounding the data from the Icelandic Meteorological Office.
The current version (2003) of the Reykjavík data is available at the website of the IMO (and has been for many years): http://www.vedur.is/Medaltalstoflur-txt/Reykjavik.txt
and the Stykkishólmur series (has not been adjusted since 1975 – only updated: http://www.vedur.is/Medaltalstoflur-txt/Stykkisholmur.txt
and Akureyri (2003 version): http://www.vedur.is/Medaltalstoflur-txt/Akureyri.txt
and Vestmannaeyjar (2003 version) http://www.vedur.is/Medaltalstoflur-txt/Storhofdi.txt
and Teigarhorn (1981 version – only updated) http://www.vedur.is/Medaltalstoflur-txt/Teigarhorn.txt
Monthly values at all stations since 1949 (1961 for secondary stations) at (click on station name): http://www.vedur.is/Medaltalstoflur-txt/Manadargildi.html
Eariler published values are available at the timarit.is website For 1924 to 1997 at: http://timarit.is/view_page_init.jsp?pubId=278&lang=is
The text is in Icelandic but in 1925 to 1956 monthly values are found at the second page of every monthly report. After 1956 the table is on pages 4 and 6. Earlier original values are available at the same site.1920 to 1923 at:
http://timarit.is/view_page_init.jsp?pubId=240&lang=is
and 1873 to 1919 at:
http://timarit.is/view_page_init.jsp?pubId=241&lang=is
Everyone can look up the numbers and compare both adjusted and earlier published values. Most of the later adjustments that have been made by the IMO are concerned with changes in the observing hours that neccessiate slight adjustments. The methodology of the current calculation of monthly means is described in detail in:
http://www.vedur.is/media/vedurstofan/utgafa/greinargerdir/1995/Climatological1960.pdf
Exactly the same method has been in use since 1956.
Bloggar | Slóð | Facebook | Athugasemdir (0)
15.2.2012 | 16:33
Calculating monthly average temperatures in Iceland – part 2
The monthly diurnal temperature range can be defined in at least two senses; (1) as the difference between the average daily maxima and minima, and (2) as the difference between the highest average fixed hour mean (FHM) and the lowest such mean.
In low and middle latitudes the sun more or less fixes the diurnal temperature cycle, the 24-hr maximum usually occurs in the early afternoon, 1 to 3 hours after local noon and the minimum at sunrise. Sea breeze, state of ground etc. can modify this general rule.
At high latitudes, as in Iceland, the noon sun remains below 15° from about 20 October to 20 February. In the southern part of the country the feeble influence of the sun can be seen in long-term averages during the greater part of the low sun period, but in the north the influence is entirely absent in December and most of January. So - the diurnal range in the second sense above (2) is very small during winter in Iceland.
Synoptic disturbances, however, cause large fluctuations in day-to-day temperatures so the diurnal range in the first sense (1) remains considerable. The synoptic scale variability does not know about the time of day, the daily maxima and minima can occur at any time during a 24-hr period. They are not confined to the hours after local noon.
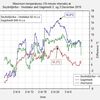
The first figure (below) shows the fixed hour diurnal variation (2) at the automatic station at Þingvellir in the Southwestern interior of Iceland during January and June (15 years of data).

Fig. 1
The red trace shows the range in June, the blue is January. These are relative means, the 24-hr average is set to 0°C. We can see that in June the maximum occurs about 1-2 hours after local noon (13:30z) [utc is used in Iceland during the whole year] and the minimum around sunrise (03:00utc - midnight at 01:30) in June. The daily range in sense (2) is 7.1°C in June.
In January the highest fixed hour mean occurs at 14 utc, so the sun clearly has some influence on the thermometer (probably more than on the air because of the setup of the sensor). The diurnal range (2) is just 0.9°C in January.
The diurnal range in sense (1) is, however, 7.5°C in January and 10.2°C in June at Þingvellir (see figure 3 for the annual cycle of (1)).
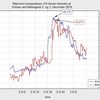
We will also take a look at another station, for contrast. This is the station Seley, situated on a small and low island off the East coast of Iceland. This station has the smallest diurnal temperature range (2) in the country and also the smallest annual range (expressed as the average difference between the warmest and coldest month). The graph is plotted using the same range as the Þingvellir plot for comparison.

Fig. 2
In January the daily range (2) is 0.1°C and in June it is only 1.0°C, January entirely flat and June nearly so. The diurnal range (1) at this station is 3.8°C in January and 3.2°C in June.

Fig 3
The seasonal variation of the two senses of the diurnal cycle at Þingvellir (W-Iceland inland). The difference between average daily maximum (tx) and minimum (tn) remains at 8 to 10°C the whole year (1), but the difference between the highest and lowest fixed hour means shows a much larger seasonal variation.

Fig. 4
The ratio of the two diurnal senses (2)/(1) shows the "persistence" of the diurnal cycle throughout the year for Þingvellir (blue) and Seley (red). At Þingvellir the daily solar cycle (2) dominates in summer but the synoptic daily variability (1) dominates in winter. At Seley the solar (2) diurnal cycle is small throughout the year so the synoptic disturbances dominate also in the summer.
As mentioned in an earlier post in this series, there is no universal agreement on the definition of the monthly mean temperature. In Iceland, combinations of fixed hour means that are supposed to approximate the full 24-hour mean have been used since the DMI took over the observations in 1873 and were continued after the establishment of the IMO in 1920. During the early and middle periods there was no universal (that is, for Iceland) formula in use. The Hovmöller reform (see an earlier post) that has been in effect since 1956 amended this state of affairs.
The next post will include a comparison of a few formulas that have been used in the calculation of monthly temperature means. These two stations will be used as examples.
Note: Icelandic mean time is = utc = z = GMT during the whole year.
Bloggar | Breytt 22.2.2012 kl. 22:04 | Slóð | Facebook | Athugasemdir (0)
30.1.2012 | 21:55
Calculating temperature averages in Iceland - part 1
This post outlines the problems of using daily maximum and minimum temperatures for the construction of long-term temperature series in Iceland. It is not a judgment on the use of the method elsewhere.
So-called fixed hour means (FHM) have been used for the calculation of mean monthly temperatures in Iceland since the Danish Meteorological Institute (DMI) took over weather observations in Iceland in 1872.
The fixed hour mean is the monthly average temperature at each of the observing times in the regular schedule at the respective station. Informally this average is also sometimes referred to as the clock mean.
In many parts of the world, the average of daily maximum and minimum temperatures (XNM) has been used for the calculation of the monthly mean temperature. In practice, there is a systematic difference between the two methods, but largely depending on location, time of the year, screen type etc. We will later look at the difference in Iceland.
There are a number of reasons for the preference of FHM rather than XNM in Iceland. We will look at a few of them:
1. The maximum and minimum thermometers are more difficult to read than other standard thermometers, as the gradation is often 0.5°C on the max and min thermometers, but 0.2°C on the others.
2. The max and min thermometers are touched and moved once or twice per day. The maximum thermometer is taken out of the screen and has to be reset by "force" (arm swing). In this process, it suffers more accidents than the fixed ones. Because of this the maximum and minimum temperature are often missing in older measurements, it took time to replace broken instruments. For this practical reason, maximum thermometers were in use at only few stations in earlier times. The minimum thermometers showed much more drift than other did, index corrections even up to 2 to 5°C were used.
3. The maximum and minimum reading practice has changed throughout time. This problem does not apply where there have been no such changes. There are at least two kinds of complications associated with changes in the reading practice.
(i)) The more serious one affected the Iceland temperature series from the 1932 to the 1950s, as the synoptic stations became more important in the network. The so-called Copenhagen observation practice (International Synoptic code of 1929) recommended that minimum temperatures were only read in the morning and the maximum only in the evening. It was also stipulated that both in the morning and the evening both thermometers should be reset and only the reset temperatures noted (for calibration purposes).
This has the consequence that if the actual highest temperature during the 24 hours really occurred during the night or the minimum during the day these were lost. In a later letter amending the codebook the observer was given free hand to note abnormal temperatures during this blank periods in the journal – but this was rarely done if at all. During a large part of the winter, the adiurnal variability (the vagaries of the weather systems) is very large in Iceland. During this time of the year many maxima and minima where thus lost. The diurnal variation is much more regular during summer and much fewer maxima or minima are lost. In lower latitudes, this problem is not as serious.
An analysis of this problem is to be found in the Hovmöller reference below. There one can read about the surprisingly large corrections that are necessary during the Copenhagen code period in Iceland.
(ii)) But why did the “Copenhagen code” introduce this problem? It was a remedy against the other reading practice effect, the problem of "double maxima" and minima. The "double maxima" are not uncommon in Iceland due to the abovementioned adiurnal variability of temperature. In the code that in 1949 replaced the Copenhagen code the maxima and minima where supposed to be read two (or four) times per day, if two times per day, then at 6 and 18 GMT. However, at six in the morning the observers must be paid at night work wages. Therefore, a compromise was made for Iceland, the maximum and minimum were there read at 9 and 18 GMT.
The 9 GMT reading has the advantage that it “caught” the real overnight minimum – in fair weather in spring and autumn it usually occurs very late in the night, after 6 GMT. By reading at 9 GMT the number of so-called double minima was largely avoided. When the minimum is read (and reset) only once per day, cold nights (night 1) smear over to a succeeding warmer night (night 2) – because the temperature at the reading time on night 1 is lower than the minimum of night 2. The Copenhagen reading practice avoided this by resetting the minimum thermometer at 18 GMT.
According to the Copenhagen practice, the maximum temperature was read and reset at 18 GMT, and a reset of the maximum thermometer at 9 GMT. In Iceland 18 GMT (17 local Icelandic time) is a bit early in the afternoon. Reading and reset time at 21 GMT should therefore be preferred. However, matter of costs also intervened. Most of the telephone (telegraph) stations in the countryside had closed by 21 GMT; they would be open only at a special cost. The 18 GMT reading was thus used at all of the synoptic stations.
When the climatic stations started to read the maximum and minimum thermometer twice per day, the reading was done at 22 GMT, which was then the traditional evening observation hour. This was changed to 21 GMT in 1961.
The practice of reading the maximum at both 9 and 18 GMT instead of 9 and 21 increased the number of “double maxima” in Iceland, i.e. when the temperature at 18 GMT on day 1 exceeds the highest maximum on the following day (day 2). The temperature at 18 on day 1 thus becomes the maximum temperature on day 2.
This also means that the average daily maximum temperature at the synoptic stations is tends to be slightly higher than the average maximum at similarly situated climatic stations.
This difficult history of maximum and minimum temperature measurements in Iceland should make it apparent why the FHM is preferred to the XNM in the construction of homogenous long-term temperature series in Iceland. However, the application of the FHM is not without problems – not at all. We will continue in the next post.
The Hovmöller (1960) report is available (in English). It is an essential read for historical climatologists, not only in Iceland, but also elsewhere.
Bloggar | Breytt 4.2.2012 kl. 02:04 | Slóð | Facebook | Athugasemdir (0)
The first temperature observations were made at Bessastaðir near Reykjavík í 1749. The eighteenth century observations are fragmentary and difficult to reconcile with modern observations. It is, however being attempted. Most of the still surviving observations before 1860 were made with instruments supplied by the Danish Scientific Society and the society supported some observations until 1880. A large observational project was initiated by The Icelandic Society of Letters in 1840. An overview of the early activity is given in Jonsson and Gardarsson (2001) and a more detailed report on the 1840 effort in Jonsson and Gardarsson (2008).
Most of the early observations series only include temperature, but in a few cases there were also observations of pressure and precipitation. An attempt has been made to construct a series of annual temperatures back to 1798 and monthly values as well for most of the years. An overview is given in the supplementary material of Wood et al. (2010). A daily pressure series has been constructed back to 1822. Jones et al. (1998) summarize this effort.
The Danish Meteorological Institute (DMI) was established in 1872. It became responsible for observations in the „auxiliary countries“ (Bilandene - The Faeroes, Iceland, Greenland and the Virgin Islands). The DMI immediately established a few stations and the number of their stations grew during the next decade. After that the number of stations remained quite stable until the First World War, but only a few of the stations observed during the whole period.
The stations where divided into two main types, the so-called main stations (Hovedstationer) and climate stations (Klimastationer). The main stations were equipped with thermometers, a barometer, hygrometer, precipitation gauge and snow frame. Three temperature, pressure, wind and weather observations were made per day, the maximum and minimum temperatures were read once per day as well and the precipitation total once per day. The observations at the DMI climatic stations were more primitive. Temperature observations where made three times per day. In a few cases the climate stations were equipped with minimum thermometers.
During the DMI period wall screens were the norm and all the official stations had temperature screens. Before 1870 the use of temperature screens was an exception. In the autumn of 1906 a cable connected with the international weather service system. A few observing stations were established at telegraph stations and the observations were distributed abroad as well as inland.
These new stations made observations three or four times per day, at fixed hours but not the same as at the traditional stations. The thermometer screens were simpler and most of the barometers were of the aneroid type whereas most of the earlier stations used mercury barometers. The new telegraph meteorological stations were decisively of a lower quality than the old main stations. The DMI did not calculate means for these stations. After the Icelandic Meteorological Office took over in 1920 most of the telegraph stations remained in a lower quality state for some time.
During the First World War the contact between the DMI and the Icelandic observers seems to have deteriorated and the station turnover was not maintained. The number of climate stations dropped and more journals are missing from this period than any other after 1873. However, in other respects the transition between the operation of the DMI and IMO was relatively smooth.
The IMO gradually reinforced the network and the number of stations grew throughout the next decades (see figure below). Maximum and minimum temperature thermometers were introduced at the stations during the 1930s as well as precipitation gauges. Records of visual observations also improved. After a new international synoptic observation code was introduced in 1929 the observation emphasis shifted gradually over to the telegraphic (now synoptic) stations. The last old-style climatic stations were phased out on 1 January 2012. The number of manned synoptic stations has also been drastically reduced during the last 10 years as more automatic stations have been established.

The figure shows the approximate number of manned stations measuring temperature in Iceland during 1869 to 2010. A few early stations are excluded (hopefully added later). The drop in number during the last 15 years has been more than compensated by automatic observations.
Some references:
Jones, P.D., T. Jónsson, and D. Wheeler, (1997) Extension to the North Atlantic Oscillation using early instrumental pressure observations from Gibraltar and South-West Iceland, International J. of Climatology Vol.17, 1433-1450.
Jónsson, T. and Hilmar Garðarsson (2001) Early Instrumental Meteorological Observations in Iceland.Climatic Change, 48, p.169-187
Jónsson T. og Hilmar G. Garðarsson (2009). Jónas Hallgrímsson og veðurathuganir á Íslandi um og upp úr 1840. (A full English version included) Skýrsla VÍ 2009-19.
Wood, KR ,JE Overland, T Jónsson and BV Smoliak (2010), Air temperature variations on the Atlantic-Arctic boundary since 1802 GRL 37, L17708, doi:10.1029/2010GL044176, 2010
Bloggar | Breytt 6.2.2012 kl. 17:39 | Slóð | Facebook | Athugasemdir (3)
27.1.2012 | 16:34
The Iceland weather blog
The Iceland weather blog is an occasional venue for information on the weather and climate of Iceland and is an offshot of my active blog in Icelandic, hungurdiskar. A blog on the recent controversy on the adjustment of Icelandic temperature series will be posted in a few days (2 to 6).
Bloggar | Slóð | Facebook | Athugasemdir (0)
Um bloggið
Iceland Weather blog

Nýjustu færslur
- Unusually high temperatures
- Unusually high sea level pressure
- Sea level pressure: Unusually low in Iceland this winter
- A new national maximum temperature record for December
- A new sea level pressure record for June in Iceland
- An unusually warm April in Iceland
- A new October high pressure record in Iceland
- A new absolute September maximum temperature record in Iceland
 hoskibui
 svatli
Nýjustu myndir
Heimsóknir
Flettingar
- Í dag (16.9.): 0
- Sl. sólarhring:
- Sl. viku: 3
- Frá upphafi: 0
Annað
- Innlit í dag: 0
- Innlit sl. viku: 3
- Gestir í dag: 0
- IP-tölur í dag: 0
Uppfært á 3 mín. fresti.
Skýringar